
Natural Source Zone Depletion
On this page:
- Schematic
- Introduction
- Other Technology Names
- Description
- Development Status
- Applicability
- Cost
- Duration
- Implementability Considerations
- Resources
Schematic
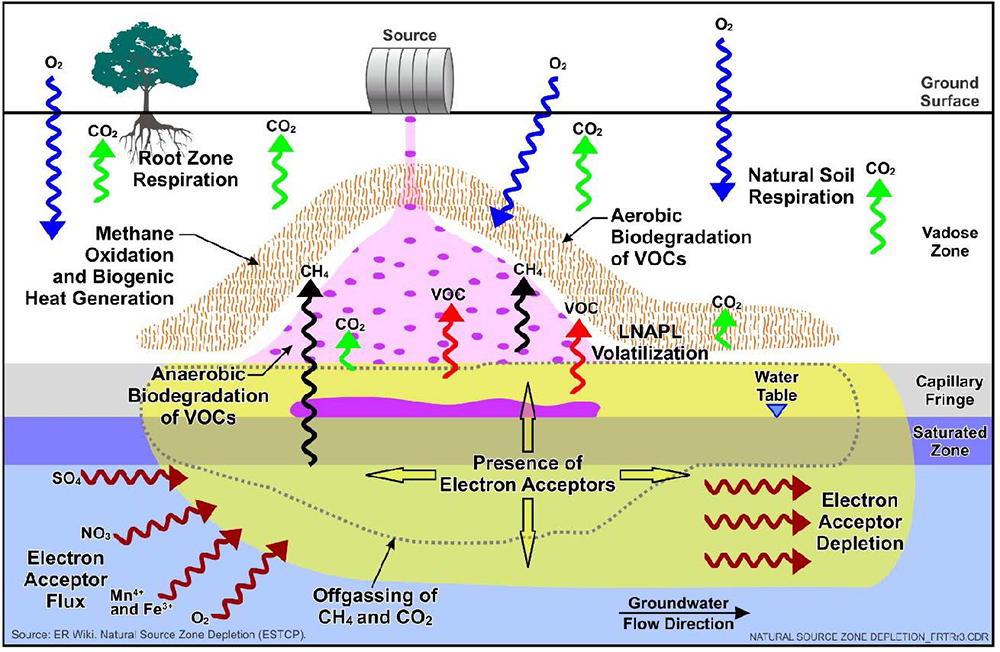
Natural Source Zone Depletion
Introduction
Natural source zone depletion (NSZD) refers to naturally-occurring processes that facilitate attenuation of light non-aqueous phase liquid (LNAPL). NSZD processes occur to varying degrees at all sites where free-phase petroleum products have been released to the subsurface. As a remediation technology, NSZD focuses on monitoring and evaluating these processes, with the objective of determining their contributions to LNAPL attenuation and impact on the time to achieve remedial action objectives.
Other Technology Names
LNAPL source attenuation
LNAPL natural attenuation
Description
NSZD consists of multiple natural in situ degradation processes that reduce the mass of LNAPL over time. Similar to monitored natural attenuation (MNA) for groundwater plumes, NSZD can be incorporated into a site remedy evaluation or final remedy in any of the following primary ways: 1) as a benchmark for LNAPL mass removal to compare the effectiveness or efficiency of other remedial technologies under consideration; 2) as a polishing step in a treatment train once active treatment reaches a defined endpoint or asymptotic condition; and 3) as an upfront remedy for all or a portion of a LNAPL source zone that meet certain physical conditions and risk criteria. Current data show LNAPL depletion rates can be both significant and sustainable over time, supporting its use as a viable remedy component, with estimated depletion rates on the order of hundreds to thousands of gallons per acre per year for larger release sites. Garg et al. (2017) compiled NSZD rates for 25 sites contaminated with a variety of petroleum products that ranged from 300 to 7,700 gallons per acre per year.
Primary NSZD mechanisms include:
- Dissolution. LNAPL gradually dissolves into groundwater. Factors including compound solubility, pH, temperature, and other geochemical conditions impact the dissolution rate. As LNAPL becomes weathered, the less soluble fractions remain and the total rate of dissolution decreases. Source zone mass is reduced as the dissolved constituents in groundwater are biodegraded.
- Volatilization. In situ volatilization of LNAPL occurs to some degree at most sites depending on the concentrations and vapor pressure of individual components as well as site-specific conditions such as aquifer temperature and lithology. Volatilization is the dominant mass transfer mechanism for LNAPL immobilized within the vadose and capillary zones. Vapors move from areas of higher concentration and pressure to areas of lower concentration and pressure. As a result, volatilized constituents tend to migrate into the vadose zone from the capillary fringe toward the ground surface where they are either biodegraded under aerobic conditions or released to the atmosphere. In the vadose zone, these constituents are further degraded and/or released to the atmosphere.
- Biodegradation. Biodegradation is a well-documented process, and generally the predominant removal mechanism for the natural attenuation of petroleum hydrocarbon constituents. Biodegradation mechanisms depend on the type and availability of electron acceptors such as oxygen (O2), nitrate, manganese, iron, and sulfate. Biodegradation occurs both aerobically and anaerobically and is known to deplete LNAPL constituents that have dissolved or volatilized (ITRC, 2009 and 2014) limiting and reducing the extent of contamination.
An NSZD evaluation is performed to assess the LNAPL attenuation rate and is used as one line of evidence to determine a suitable site management approach. The evaluation helps to answer questions such as: 1) how long will LNAPL persist if not treated, 2) will active treatment help to achieve remedial action objectives in a reasonable timeframe, and 3) are there portions of a site where treatment can cost-effectively increase depletion rates (NAVFAC, 2010). In addition, an NSZD evaluation can be used to (ESTCP and SERDP, 2017):
- Develop an LNAPL conceptual site model (LCSM)
- Quantify NSZD rates for LNAPL source area and residual footprint removal rates
- Delineate the areal extent of the LNAPL source area, residual footprint, and dissolved plume
- Assess historical LNAPL stability and product thickness
- Compare current LNAPL NSZD rates to LNAPL recovery rates using an alternative remedy
- Support a cost/benefit analysis of future remediation by evaluating NSZD to an alternative remedy
- Determine an endpoint for active remediation (i.e., NSZD attenuation rate is greater than the LNAPL removal rate from an active remedy)
NSZD assessments can be either qualitative or quantitative (ITRC, 2009). A qualitative screening assessment typically involves identifying the processes/mechanisms that are contributing to NSZD and/or gathering data that demonstrate the source zone is redistributing contaminant mass to groundwater, to the vadose zone, or both (NAVFAC, 2010). A quantitative assessment involves measuring, collecting, and analyzing site data to determine mass flux and related attenuation/depletion rates for each of the processes/mechanisms that are naturally decreasing LNAPL source zones (NAVFAC, 2010).
A common objective of NSZD evaluations is to estimate the mass of LNAPL that has attenuated over a specific time span (e.g., pounds per year or gallons per year). This natural source zone depletion rate can be determined by summing the mass that is removed in the aqueous phase and the mass that is removed in the vapor phase. Necessary data are summarized in Table 1. Aqueous phase mass removal is well established as part of monitored natural attenuation (MNA). LNAPL constituents slowly dissolve into groundwater and are transported downgradient from the source area where anaerobic and aerobic biodegradation processes serve to degrade them to methane (CH4) and water using a variety of electron acceptors including oxygen (O2), nitrate, iron (III), manganese (IV), sulfate, and carbon dioxide (CO2). Time-series groundwater samples are collected at various locations upgradient, downgradient and side-gradient of the source area and are analyzed for LNAPL constituents of concern, terminal electron acceptors, and their reaction products. Natural attenuation screening tools such as BIOSCREEN (EPA, 1996) and Natural Attenuation Software [NAS] (Virginia Tech, USGC, NAVFAC, 2005) can be used to determine the degree to which aqueous-phase compounds are attenuating. Various documents are available that provide guidance to evaluate the resulting data to determine mass loss in the aqueous phase due to biodegradation (AFCEE, 1995; ITRC, 2009; WDNR, 2015).
Research has demonstrated that the primary mechanism through which LNAPL attenuates is through methanogenesis of free-phase oil within pore spaces in the saturated and unsaturated zones and subsequent transport of the resulting gas into an oxidation zone where it is aerobically converted to CO2 (Garg et al., 2017). Research also has shown that the biodegradation capacity of the aqueous phase is a small fraction of what potentially can be degraded via methanogenesis of the free-phase oil (Garg et al., 2017). Hence, a more accurate (and larger) depletion rate is determined when considering vapor phase losses compared to only considering losses associated with the aqueous phase.
Site-specific vapor phase hydrocarbon depletion rates can be estimated using measurements from one of the following field methods:
- Concentration Gradient Method was the first method developed to evaluate hydrocarbon depletion in the vapor phase. It is based on determining O2, CO2, and CH4 concentration gradients in the vadose zone (ESTCP, 2017). Nested soil gas monitoring points are installed at two or more depths in the vadose zone and are monitored for O2, CO2, CH4 and volatile organic compounds using field instruments. The mass flux of these constituents is determined based on application of Fick's Law, which is defined as the vertical concentration gradient multiplied by an effective diffusion constant for the contaminant of concern. This method is not being used as frequently as in the past because other less costly and labor-intensive methods (see below) have been developed and proven in the field. One primary disadvantage of this method is that it provides a discrete measurement in time and location, which can vary considerably. Hence, measurements at multiple locations and times are required to accurately estimate degradation rates. Another disadvantage is that the diffusion coefficient must be estimated or measured and can change with location, temperature, and soil properties (RITS, 2017). Lastly, common to all vapor flux estimation methods, the presence of an impermeable surface seal, such as asphalt or concrete, can influence results. Effective diffusion coefficients can vary by several orders of magnitude at heterogeneous sites based on changes in soil hydraulic conductivity and moisture content.
- Dynamic Closed Chambers are specially designed and vented chambers that are placed on the ground for a short time to provide a direct measurement of CO2 flux. The chamber is equipped with an internal pump to recirculate the vapor within the chamber through an infrared gas analyzer. Concentrations are measured over several minutes. The CO2 concentration changes over time are fitted to a curve and converted to a flux by dividing the resulting concentration by the soil surface area occupied by the unit (ESTCP, 2017). Multiple tests can be performed at the same location and results are plotted to determine changes in flux over a longer period. This method is relatively inexpensive, and the data are immediately available in the field; however, data are collected over a few minutes and therefore represent a snapshot in time. Similar to the gradient method, flux should be measured at several locations and time intervals to obtain more accurate results. Impermeable surface seals also will influence results obtained using this method.
- Passive Flux Traps are static flow-through chambers designed to trap CO2 onto a sorbent material located inside the unit. Each chamber comes equipped with two filters: one to capture CO2 diffusing from the ground and the other to capture any CO2 that diffuses into the chamber from atmospheric air. Traps have become a widely-used method for calculating CO2 flux because they are easy to apply in the field, requiring little labor and are relatively inexpensive. The traps generally are deployed for about 2 weeks and additional time is required for laboratory analysis. An analysis of the carbon 14 isotope (14C) also can be performed to differentiate between the CO2 generated by biodegradation of the LNAPL from CO2 generated by other non-LNAPL sources, which can eliminate the need to perform the analysis at a non-contaminated background location. Although this is an economical and easy to deploy method, there are several limitations that should be recognized, including:
- Results are not immediately available.
- Because results can vary substantially from one location to another due to differences in hydrocarbon distribution and preferential pathways, data must be extrapolated.
- Ponding of water can occur beneath the trap during rain events, which can interfere with CO2 uptake.
- The presence of an impermeable surface seal can impact results.
- The Thermal Gradient Method takes advantage of the fact that heat is liberated as CH4 is biodegraded to produce CO2, which is a highly thermogenic (heat producing) reaction. One or more strings of multi-level thermocouples can be installed in boreholes at various depths to measure the subtle temperature changes produced as the CH4 is degraded. Proprietary models are used to calculate LNAPL depletion rates based on the changes in temperature. This is the most recent development for assessing NSZD depletion rates and research is ongoing to validate results against the methods described above. The primary disadvantage is that drilling generally is required to advance boreholes to deploy thermocouples, which increases the cost of this method, although methods are being developed and tested that deploy thermocouples in monitoring wells to provide a rough estimate of NSZD rates.
The mass of hydrocarbons eliminated in the vapor phase is complicated by other natural processes that consume O2 and produce CO2 (ESTCP, 2017) such as the oxidation of naturally-occurring organic matter (e.g., plant material). Because these naturally-occurring processes occur to different degrees at different sites, background values are usually determined. In general, similar methods must be used to measure flux at locations representative of site conditions but do not contain petroleum hydrocarbon contamination. Background depletion rate results are then subtracted from the values obtained in the contaminated area.
Table 1. Key Data to Evaluate NSZD (Adapted from NAVFAC, 2010)
| Data Needed | Use |
| Groundwater | |
| Hydraulic conductivity, gradient, and source zone configuration | Estimate water flow through the source zone. |
| Dissolved electrong acceptor reactant (02, NO3-, SO42-) and product (Fe2+, Mn2+, CH4) up- and down-gradient of the source zone | Changes in values between up- and down-gradient wells are used to estimate hydrocarbon mass depletion rates and to provide evidence of biodegradation. |
| Dissolved hydrocarbon concentrations up-and down-gradient of the source zone | Determine hydrocarbon source zone mass depletion rate due to dissolution not accounted for by biodegradation. |
| Volume of groundwater and dissolved hydrocarbon and electron acceptor related data | Estimate depletion rate by biodegradation based on mass balance extrapolation of changes in hydrocarbon mass and electron acceptors traveling through LNAPL zone over a given period of time. This process is used in natural attenuation models such as Bioscreen and NAS. |
| Vados Zone (one method is sufficient) | |
| Soil gas for hydrocarbons and respiration and biogenic gases (O2, CO2, CH4). Effective diffusion coefficient (can be estimated using soil moisture and total porosity; or measured in the field) | Depleted O2 and generation of CO2and CH4 is used to estimate NSZD. Also provides evidence of biodegradation. Hydrocarbon and biogenic gas profiles demonstrate volatilization and vapor transport. |
| CO2 surface flux measurements (chamber, CO2 trap, or thermal methods) | Estimate mass depletion rate due to biodegradation. Provides a vados zone mass depletion rate estimate independant of soil gas profiles and effective diffusion coefficient. |
| If soil vapor extraction (SVE) or bioventing system is operating, in-situ respiration tests typically run a system turned off and O2 and CO 2 measurements taken at frequent intervals over time at multiple vadose zone gas probe nests. | O2 depletion and CO2 generation with time used to estimate biodegradation rate at the differnt monitoring locations and depths throughout the treatment zone. In-situ respiration testing used to estimate biodegration rates for bioventing systems and optional for SVE systems involving hydrocarbons. |
In addition to determining NSZD rates at a site, there are several other site-specific data that should be determined and evaluated to demonstrate to the regulating authorities that NSZD is an acceptable alternative to active remediation. These may include:
- Remaining LNAPL and dissolved phase constituents are not a risk to human health and the environment.
- Natural attenuation of the dissolved phase plume is occurring at the site and is expected to further mitigate risk from the release.
- The areal extent of the LNAPL plume is shown to be stable or decreasing.
- The areal extent of the dissolved plume at the site is shown to be stable or decreasing.
- At sites with active LNAPL recovery, evaluation of corrective actions performed at the site shows asymptotic recovery trends through seasonal water table variations.
- It is not cost-effective to actively recover remaining LNAPL and/or it has low mobility/recoverability.
- Access to the LNAPL body is an issue, such as the remaining LNAPL lies under a structure or roadway and cannot be reached, and/or geology or hydrogeology prevents or greatly restricts LNAPL removal (e.g., LNAPL is trapped in fractured bedrock).
Development and Implementation Status
The following checklist provides a summary of the development and implementation status of NSZD:
☐ At the laboratory/bench scale and shows promise
☐ In pilot studies
☒ At full scale
☐ To remediate an entire site (source and plume)
☐ To remediate a source only
☐ As part of a technology train
☐ As the final remedy at multiple sites
☐ To successfully attain cleanup goals in multiple sites
NSZD is available through the following vendors:
☒ Commercially available nationwide
☐ Commercially available through limited vendors because of licensing or specialized equipment
☒ Research organizations and academia
Applicability
|
Contaminant Class Applicability Rating for NSZD (Rating codes: Demonstrated Effectiveness, ◐ Limited Effectiveness, No Demonstrated Effectiveness, I/D Insufficient Data, N/A Not Applicable) | ||||||||
|---|---|---|---|---|---|---|---|---|
Nonhalogenated VOC |
Halogenated VOC |
Nonhalogenated SVOC |
Halogenated SVOC |
Fuels |
Inorganics |
Radionuclides |
Munitions |
Emerging Contaminants |
| I/D | N/A | I/D | N/A | ● | N/A | N/A | N/A | N/A |
| 1 | 1 | |||||||
NSZD strictly applies to attenuation of the LNAPL source in the vadose and saturated zones. Attenuation processes associated with NSZD have been well documented as part of MNA and serve to degrade individual dissolved-phase constituents and to reduce the volume of LNAPL in the subsurface. However, insufficient data exist to estimate the timeframe required for using NSZD to achieve groundwater cleanup criteria or to reduce the LNAPL volume to levels that do not pose a risk to human health or the environment for those constituents at this time.
Cost
NSZD is a relatively low-cost technology. It is assumed that a detailed CSM is available and, therefore, nature and extent of contamination, hydrogeology, lithology, and other site-specific conditions are relatively well understood. Similar to MNA, primary costs are associated with sampling and analyses. Major cost drivers include:
Upfront Costs
- Areal extent of contamination
- Need for verification data for qualitative screening versus quantitative estimates of depletion rates for remedy component evaluation
- Number and design of wells required for groundwater samples
- Number and design of surface monitoring locations versus borings/wells for thermocouples (dependent on method used to determine depletion rates)
Operation and Maintenance Costs
- Number of monitoring locations
- Number and types of analytes
- Type of vapor monitoring performed (i.e., gradient, flux traps, chamber, thermal)
- Regulatory requirements
- Monitoring frequency dependent on quantity of historical data and decision-making purpose
The list above highlights those cost dependencies specific to NSZD and does not consider the dependencies that are general to most in situ remediation technologies. Click here for a general discussion on costing which includes definitions and repetitive costs for remediation technologies. A project-specific cost estimate can be obtained using an integrated cost-estimating application such as RACER® or consulting with a subject matter expert.
Duration
NSZD is a long-term treatment technology expected to require years to decades to remediate an LNAPL source area. NSZD treatment duration (time required to reach cleanup goals) is dependent on the mass of LNAPL in the aquifer, the soil volume that it occupies, biodegradation rate, which is highly influenced by the type of petroleum contamination and the degree of weathering that already has occurred. At many legacy sites, active product recovery can result in less LNAPL recovered than NSZD. Rates ranging from 300 to 7,700 gallons removed per acre per year have been documented (NAVFAC, 2017) and a degradation rate of about 1,600 gallons per acre per year was reported at a crude oil spill site (Sihota, 2011). An estimate of the time required for NSZD to effectively treat a plume can be made if the initial mass of LNAPL is known and the NSZD rates are known. However, because the processes that govern are very complex and NSZD rates will decrease over time as more easily degradable compounds are eliminated through degradation, volatilization, etc., it is difficult to predict the timeframe for remediation using current models (ITRC, 2018).
Implementability Considerations
The following are key considerations associated with applying NSZD:
- Site-specific depletion rates are impacted by many factors including, but not limited to, lithology, depth to groundwater and flow, impermeable ground cover (e.g., asphalt), aquifer temperature, soil moisture content, and site climate including rainfall and ambient air temperature. Because many of these factors change over time, NSZD rates can fluctuate significantly both during a single day and over time.
- NSZD targets the LNAPL source zone. Low levels of residual LNAPL can be achieved; however, the time to achieve low levels is often not short. Once NSZD rates are established, it may be possible to transition to long-term monitoring until applicable regulatory requirements have been met instead of performing MNA over lengthy periods to measure naturally-occurring processes.
- NSZD is a proven and reliable method to deplete LNAPL at a site. A low level of maintenance is required to implement this technology, which is limited to sampling of groundwater, soil, and/or vapor, performing a variety of analyses, and data analysis.
- The depletion rate measurement methodologies and data interpretation are complex and require specialized knowledge and experience, especially trying to incorporate background interferences. Multiple degradation reactions that occur concurrently can be both aerobic and anaerobic and will vary at different locations and depths, which must be accounted for in the sampling design and data interpretation.
- Given NSZD's limited history, little is known about long-term trends in depletion rates and how changes occur over time, which makes it difficult to project timeframes to attain remediation endpoints. Difficulties in accurately estimating initial LNAPL mass further complicates remediation timeframe estimates.
- NSZD estimates quantify total hydrocarbon mass loss over time. Loss or degradation rates of individual chemicals from soil or LNAPL phases are not estimated. Therefore, at present, the use of NSZD data to achieve chemical-specific cleanup criteria in groundwater is limited (ESTCP, 2017). However, NSZD can provide strong evidence to support risk-based closure of a site. At many sites, the estimated LNAPL degradation rates by NSZD are comparable to or greater than free product recovery rates by many established active methods.
- Carbon dioxide flux may be affected by the presence of asphalt, concrete, and other impermeable surface seals. Methods that directly measure carbon dioxide flux also may be impacted by the presence of surface seals.
- NSZD may be perceived as a "do nothing" approach; stakeholder and public education and a robust monitoring program are critical to facilitating acceptance.
Resources
AFCEE. Technical Protocol for Evaluating Natural Attenuation of Chlorinated Solvents in Ground Water (1998) (PDF) (248 pp, 2.46 MB)
This document provides an overview of principles and practices for monitored natural attenuation of petroleum hydrocarbons in groundwater.
American Petroleum Institute. Quantification of Vapor Phase-Related Natural Source Zone Depletion Processes (2017)
This document provides guidance to design and implement NSZD.
Environmental Protection Agency. BIOSCREEN, Natural Attenuation Decision Support System (1996) (PDF) (100 pp, 1.15 MB)
This document describes application of a modeling tool that simulates remediation through natural attenuation of dissolved hydrocarbons at petroleum fuel release sites.
Garg, Sanjay; Newell, Charles; Kulkarni, Poonam, King, David; Adamson, David; Renno, Maria; and Sale, Tom. Overview of Natural Source Zone Depletion: Processes, Controlling Factors, and Composition Change (2017). Published in Groundwater Monitoring and Remediation, Vol 37, Number 3, pages 62-81.
This journal article documents current knowledge of NSZD processes and research needs.
Interstate Technology Regulatory Council (ITRC). Natural Source Zone Depletion at Sites with LNAPL (2009) (PDF) (76 pp, 1.30 MB)
This document describes NSZD processes and provides a methodology for performing quantitative mass balance estimates for calculating removal rates of non-aqueous phase liquids.
ITRC. Petroleum Vapor Intrusion. Fundamentals of Screening, Investigation, and Management (2014) (PDF) (389 pp, 24.2 MB)
This document describes a process for screening, investigating and managing sites contaminated with petroleum hydrocarbons to address petroleum vapor intrusion. It also describes biodegradation processes and provides a methodology for assessing biodegradation of vapor phase petroleum hydrocarbon constituents.
ITRC. Light Non-Aqueous Phase Liquid (LNAPL) Site Management: LCSM Evolution, Decision Process, and Remedial Technologies. LNAPL-3. (2018) (PDF) (23 pp, 2.09 MB)
This guidance document provides best practices for management and cleanup of LNAPL sites. Appendix B discusses the importance of incorporating NSZD into the LCSM and provides guidance for applying NSZD at a site.
Naval Facilities Engineering Command (NAVFAC). LNAPL Site Management Handbook (2010) (PDF) (23 pp, 2.09 MB)
This handbook provides an overview of effective strategies for managing LNAPL-contaminated sites to ensure protectiveness of human health and the environment, while simultaneously avoiding unnecessary and prolonged remedial efforts.
NAVFAC. Environmental Restoration. New Developments in LNAPL Site Management (2017)
This document describes recent research and tools for evaluating NSZD and provides data demonstrating the importance of anaerobic methane-generating biodegradation processes in the vadose and saturated zones.
RITS. LNAPL Site Management. How to use Tools to Support Monitored Natural Attenuation and Risk-Based Closure
This presentation includes information on LNAPL transmissivity, recoverability, and removal, and moving toward a passive remedy such as NSZD.
Sihota, N., Singurindy, O., and Mayer, K. CO2-Efflux Measurements for Evaluating Source Zone Natural Attenuation Rates in a Petroleum Hydrocarbon Contaminated Aquifer (2011). Published in Environmental Science and Technology. Vol 45. p. 482-488
This journal article describes techniques used and resulting NSZD rates at the Bemidji crude oil site in Minnesota.
Strategic Environmental Research and Development Program (SERDP)/Environmental Security Technology Certification Program (ESTCP). ER Wiki Natural Source Zone Depletion
This Wiki provides an overview of NSZD processes and industry-accepted methodologies and practices for monitoring and assessing depletion rates.
VirginiaTech, USGS, and NAVFAC. Natural Attenuation Software (NAS) Users Manual, Version 2 (2005) (PDF) (55 pp, 3.44 MB)
This document describes application of the NAS modeling tool that simulates remediation through natural attenuation of dissolved hydrocarbons at petroleum fuel release sites.
Wisconsin Department of Natural Resources (WDNR). Guidance on Natural Attenuation for Petroleum Releases (2014) (PDF) (98 pp, 704 KB)
This document provides technical guidance for evaluating natural attenuation processes in remediating groundwater contaminated with petroleum products.
Effective to treat petroleum constituents as demonstrated by a wide-range of studies and evaluations of natural attenuation. However, insufficient data exists to use NSZD to achieve chemical-specific cleanup criteria using current NSZD tools and methods. ↩
Effective to treat petroleum constituents as demonstrated by a wide-range of studies and evaluations of natural attenuation. However, insufficient data exists to use NSZD to achieve chemical-specific cleanup criteria using current NSZD tools and methods. ↩